We consult our member companies every quarter about their assessment of the economic situation. The result is the IK Economic Trend. It is regarded as the barometer of the plastics packaging industry. The individual working groups define benchmarks whose results are only made available to participating member businesses.
We also publish production statistics and international trade statistics. Please contact us in case you are interested in any material.
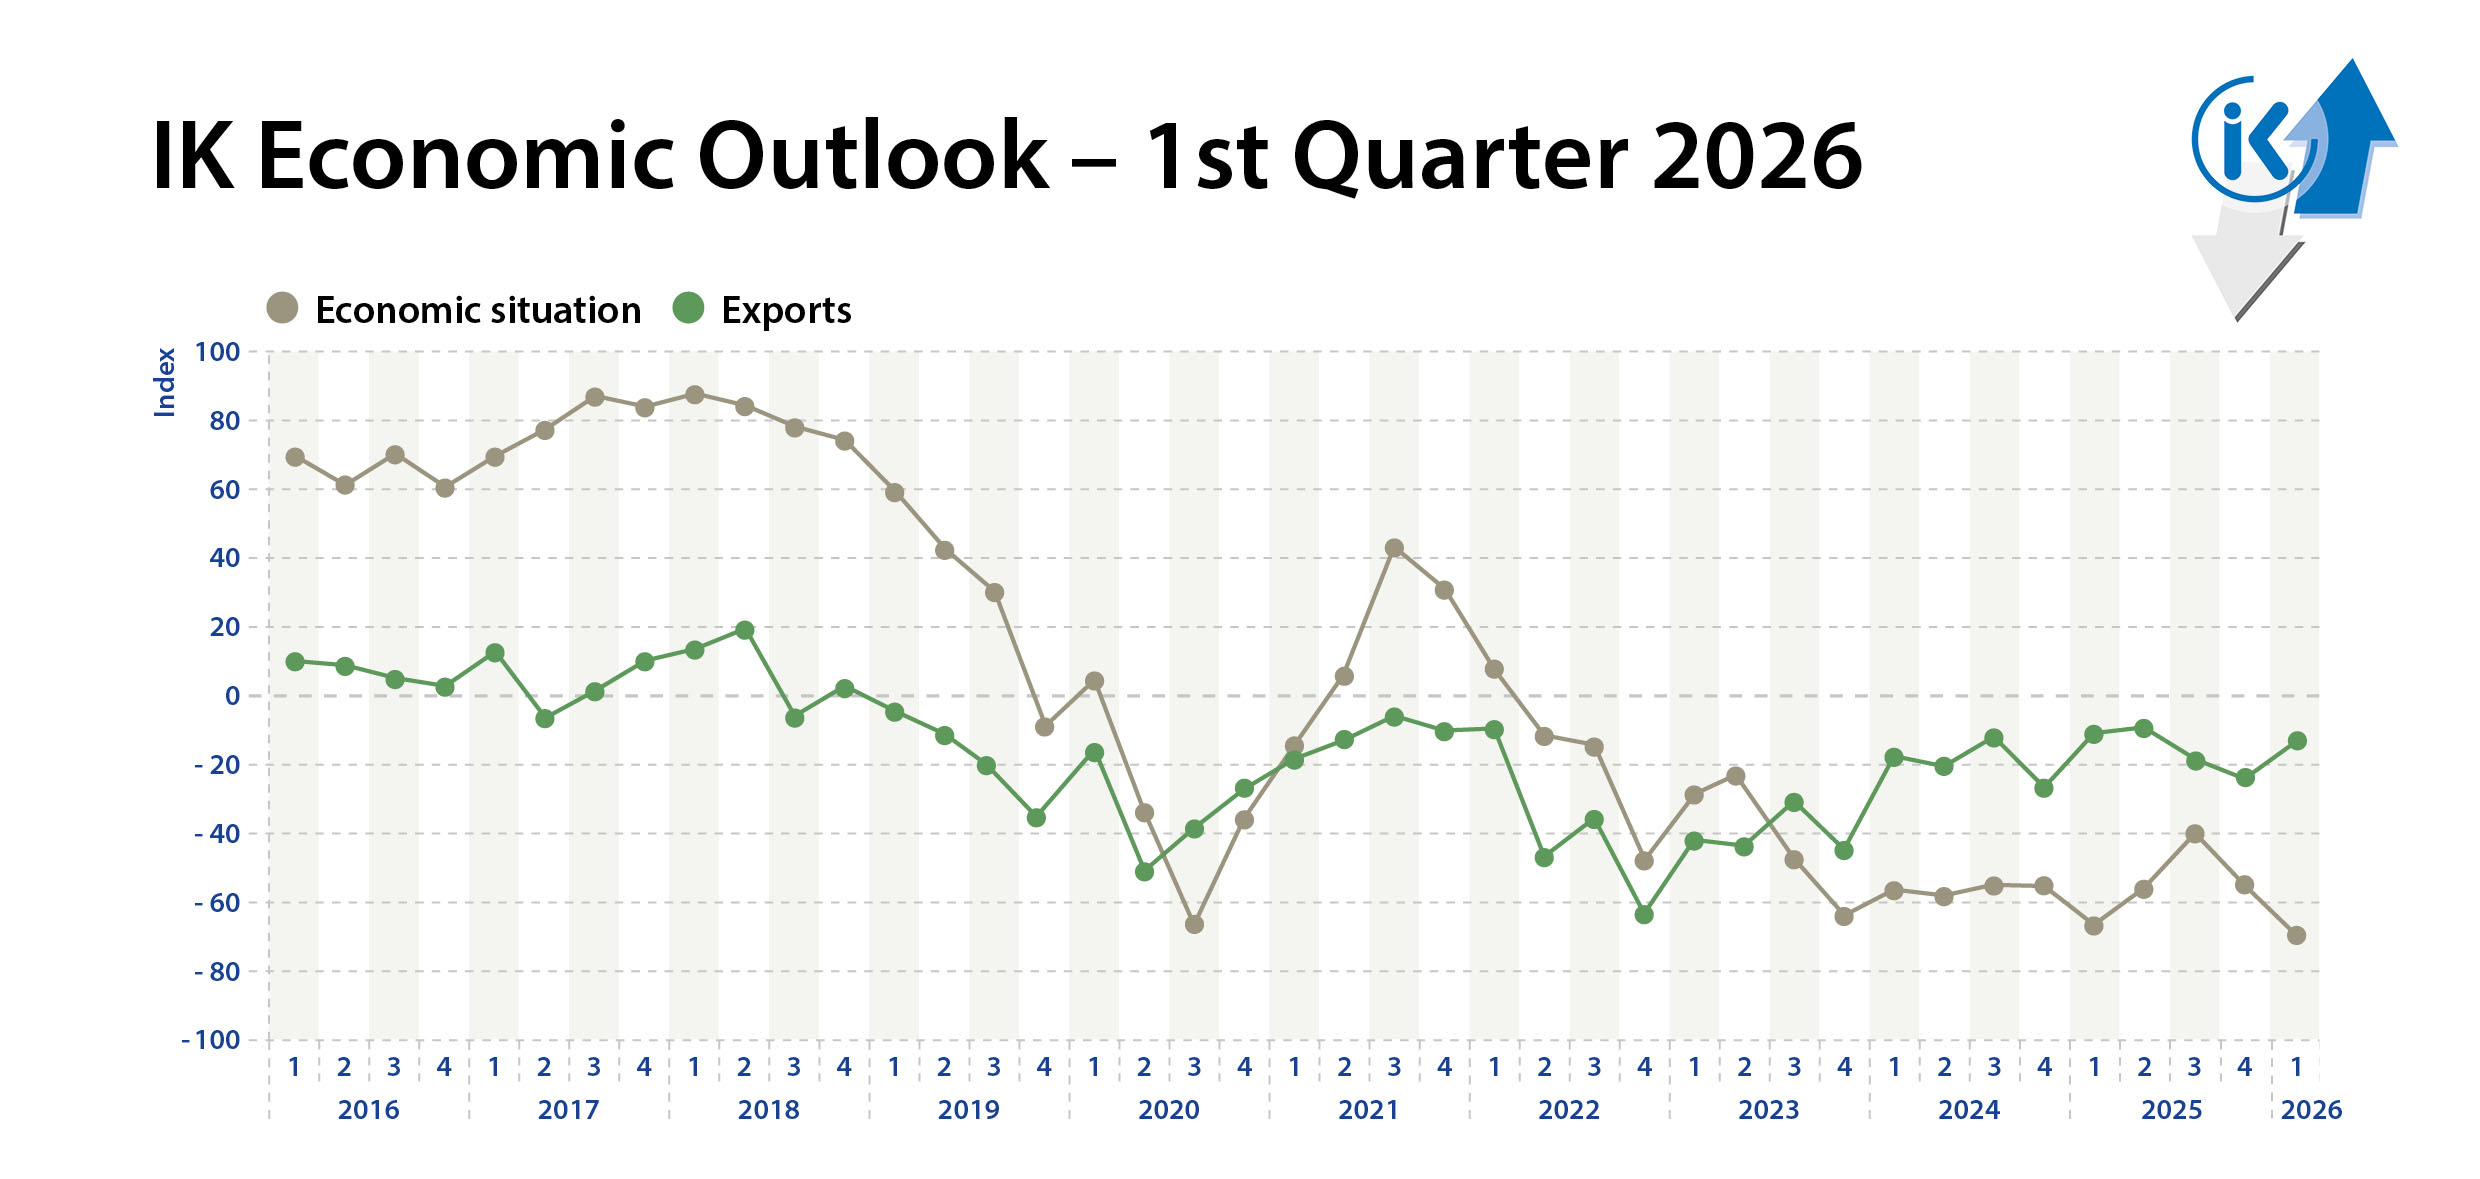
Source: IK; Balance: share of positive reports minus share of negative reports
International trade
International trade in films1 and plastics packaging2 2023/2024 (in € million)
| Imports | Exports | |||||
|---|---|---|---|---|---|---|
| 2023 | 2024 | 2023/ 2024 Change in % |
2023 | 2024 | 2023 / 2024 Change in % |
|
| Films | ||||||
| LDPE | 619 | 637 | 2,8 | 892 | 873 | -2,2 |
| HDPE | 144 | 141 | -1,7 | 422 | 433 | 2,8 |
| Ethylene copolymers / others | 289 | 276 | -4,5 | 734 | 711 | -3,1 |
| PP | 727 | 766 | 5,3 | 1.054 | 1.114 | 5,7 |
| PS | 150 | 139 | -7,3 | 341 | 316 | -7,4 |
| PET + Polyester | 373 | 360 | -3,5 | 650 | 642 | -1,2 |
| Regen. Cellulose3 | 13 | 12 | -3,5 | 3 | 4 | 10,1 |
| Cellulose acetate | 5 | 4 | -21,4 | 11 | 12 | 6,4 |
| PA | 41 | 38 | -8,7 | 96 | 93 | -3,3 |
| PC | 111 | 96 | -14,1 | 127 | 126 | -1,2 |
| Packaging | ||||||
| Cups, containers, buckets, cases | 750 | 712 | -5,0 | 1.275 | 1.231 | -3,5 |
| Bags, pouches, sacks etc. made from: | ||||||
| PE | 753 | 818 | 8,7 | 913 | 859 | -5,9 |
| PVC | 10 | 10 | 0,5 | 12 | 9 | -21,0 |
| other plastics | 263 | 257 | -2,2 | 244 | 224 | -8,2 |
| Bottles | ||||||
| < 2l | 581 | 556 | -4,4 | 584 | 613 | 5,0 |
| > 2l | 112 | 112 | 0,3 | 220 | 217 | -1,2 |
| Closures | 677 | 689 | 1,7 | 1.134 | 1.149 | 1,2 |
| Other transport packages | 671 | 634 | -5,6 | 715 | 707 | -1,1 |
| Total | 6.288 | 6.255 | 0,5 | 9.428 | 9.334 | 1,0 |
1) Films, boards, sheets 2) Excerpts
3) Preliminary values. The Federal Statistical Office assumes an incorrectly reported commodity code.
Source: Destatis; Last updated: February 2025
Production
Production for plastics packaging and packaging films in Germany 2024/2025:
Total
| Packaging categories | Volume in 1,000 t | Change | Sales in € | Change | ||
|---|---|---|---|---|---|---|
| 2024 | 2025 | in % | 2024 | 2025 | in % | |
| Packaging films | 1.443 | 1.414 | -2,0 | 5.431 | 5.180 | -4,6 |
| Pouches, carrier bags, sacks | 375 | 365 | -2,5 | 1.321 | 1.326 | 0,4 |
| Cups, containers, cases, crates, pallets | 712 | 744 | 4,5 | 3.253 | 3.372 | 3,7 |
| Bottles | 586 | 584 | -0,4 | 2.414 | 2.413 | 0,0% |
| PET bottles | 411 | 412 | 0,3 | No breakdown into PET and other plastics |
||
| Bottles, other plastics | 175 | 171 | -2,1 | |||
| Closures | 304 | 323 | 6,5 | 1.717 | 1.681 | -2,1 |
| Barrels, canisters, buckets | 239 | 236 | -1,3 | 1.292 | 1.302 | 0,8 |
| Other | 192 | 191 | -0,5 | 1.113 | 1.094 | -1,7 |
| Total | 3.850 | 3.857 | 0,2 | 16.539 | 16.386 | -1,0 |
Source: GVM, IK, Destatis; Last updated: February 2025
Recycling statistics
Our association intends to reach the ambitious targets of one million tonnes of recyclates (or renewable raw materials) in use and a proportion of 90 per cent of recyclable and reusable plastic household packages by 2025.
We will only achieve these targets if recycling plastic is available in the required quantities and qualities and there is the corresponding demand from our customers. We ensure the quality of progress by means of regular monitoring.